Monitoring Unblu in a Kubernetes cluster
When you install Unblu into a Kubernetes cluster, you can choose to embed a preconfigured metrics and monitoring stack. The stack has the following components:
-
Prometheus continuously discovers all pods, scrapes metrics, and stores them on disk.
-
Grafana retrieves metrics from Prometheus and visualizes them using dashboards.
-
Alertmanager receives alerts defined in Prometheus. It deduplicates them and then sends them to any configured outside system.
-
kube-state-metrics (KSM) generates and exposes cluster-level metrics scraped by Prometheus.
-
Blackbox exporter is used by Prometheus to run HTTP probes that test the availability of certain cluster components.
How each component works is outlined below.
Prometheus
Prometheus is at the core of Unblu’s metrics and monitoring suite. It’s used for several tasks:
-
Discover all pods in the namespace using the Kubernetes API.
-
Scrape metrics from discovered pods.
-
Store scraped metrics on disk.
-
Evaluate alert rules and send alerts to Alertmanager.
-
Run queries written in PromQL on the collected metrics.
Prometheus has a flexible configuration and can be used to monitor a variety of sources. The instance that’s deployed with Unblu is configured as outlined below.
-
Pods exposing metrics are annotated with
prometheus.io/scrape=true. Metrics are then accessed using an HTTPGETrequest onhost:80/metricsor on the port and path specified in a separate annotation.Listing 1. Annotations evaluated by Unblu’s Prometheus instanceannotations: (1) prometheus.io/scrape: "true" prometheus.io/port: "7080" prometheus.io/path: "/system/prometheus"1 These annotations access metrics with a GETrequest on http://host:7080/system/prometheus. -
The HTTP metrics endpoint returns metrics in the following text format:
Listing 2. Prometheus metrics format# documentation metrics_name{tag="sample"} number -
Some applications provide such a metrics endpoint out of the box. Others have an exporter that converts the metrics into the Prometheus format (see Prometheus exporters).
Listing 3. Prometheus metrics format# HELP http_request_total http request counter # TYPE http_request_total counter http_request_total{handler="/",method="get",statuscode="200"} 2 http_request_total{handler="/*",method="get",statuscode="200"} 20 http_request_total{handler="/*",method="get",statuscode="302"} 3 -
Prometheus automatically deletes old metrics when they use more than 6 GiB of disk space. The retention period varies depending on the amount of activity in the cluster.
-
You can use a port forward for temporary access to Prometheus.
Listing 4. Use a port forward to export Prometheus on localhost:9090kubectl port-forward service/prometheus 9090:80
Grafana
Grafana is an open-source analytics and monitoring application that supports a wide variety of data sources. Unblu’s metrics suite only uses the Prometheus data source.
-
All the configuration required, including the dashboards, are provisioned automatically, so the Grafana installation doesn’t use a persistent disk.
-
By default, Grafana isn’t accessible from outside the cluster. For temporary access, use a port forward. For permanent access, use an Ingress/Route.
Listing 5. Use a port forward to export Grafana on localhost:3000kubectl port-forward service/grafana 3000:80 -
Grafana is configured to create an admin user with "secret" as the default password in
grafana-secrets.yaml.Always patch the grafanasecret to a more secure password when exposing it using an Ingress/Route.
Alertmanager
Prometheus is configured with an array of product-specific alerts (see alerts.yaml).
alert: FailedLogins
expr: "rate(session_logins_total{result="failed"}[1m]) > 1"
for: 1m
labels:
  severity: critical
annotations:
  summary: "More than one failed login per second"
  description: "{{ $value }} failed logins in the last minute on {{ $labels.kubernetes_pod_name }}"
Prometheus evaluates the alerts and then sends them to the Alertmanager deployment.
In its default configuration (see alertmanager.yml), no action is taken. Here’s an example action that sends alerts to a Slack channel:
global:
  slack_api_url: https://hooks.slack.com/services/<secret_part> (1)

receivers:
- name: default-receiver
  webhook_configs:
    - url: https://yourcompany.com/your/webhook/endpoint (2)
  slack_configs:
    - channel: '#test' (3)
      send_resolved: true
      icon_emoji: ':rotating_light:'
      title: 'Alert: {{ .Status | toUpper }}'
      text: |
        {{ range .Alerts }} *{{ index .Annotations "summary" }}* - {{ index .Annotations "description" }} _({{ index .Labels "kubernetes_namespace" }})_
        {{ end }}

route:
  group_interval: 5m (4)
  group_wait: 10s
  receiver: default-receiver
repeat_interval: 3h (5)| 1 | Replace <secret_part> with the appropriate value. |
| 2 | Webhook URL to POST the alert to. Consult the Prometheus documentation for the exact format. |
| 3 | Slack channel to use when posting the alert. |
| 4 | Only send the resolved notification when the alert wasn’t firing for five minutes. |
| 5 | Wait for three hours after an alert was sent before sending it again. |
To use a project-specific Alertmanager configuration, add the following lines to kustomization.yaml:
kustomization.yaml
configMapGenerator:
- name: alertmanager-config
  behavior: replace
  files:
    - alertmanager.yml
Silencing alerts in Alertmanager
You can mute alerts in Alertmanager. You may decide to do this, for example, because your installation has a known issue.
First, create a port-forward to access Alertmanager:
kubectl -n namespace port-forward service/alertmanager 9093:80You can now access Alertmanager on localhost:9093.

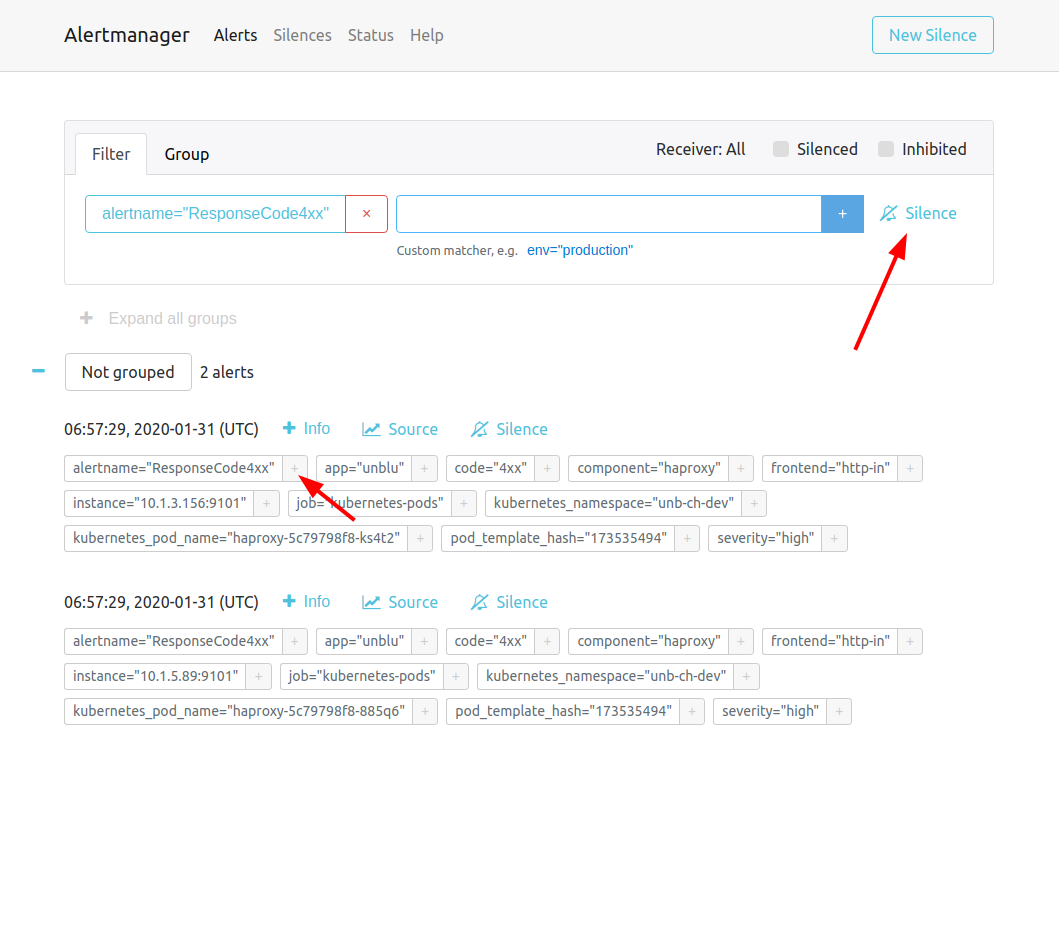
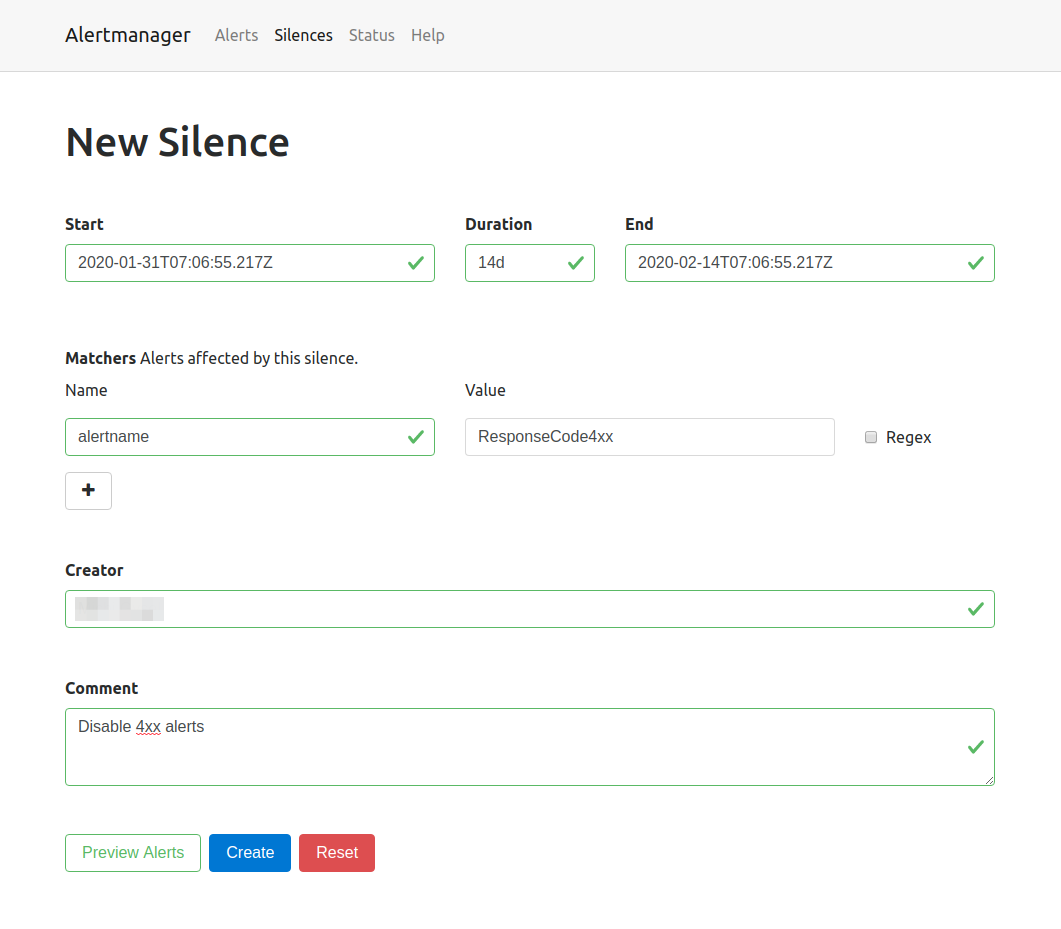
Next, select the label that identifies the alert you want to silence, for example alertname=ResponseCode4xx, and click Silence.

Silences are valid for a specific time such as 14d or 24h and can be documented with a creator as well as a comment.
kube-state-metrics
kube-state-metrics (KSM) is a service that continuously polls the Kubernetes API and exposes the information as Prometheus metrics. Examples of such metrics are:
-
kube_deployment_status_replicas_available{deployment="collaboration-server"}--Available Collaboration Server pods -
kube_pod_container_info{pod="collaboration-server-68b4c86fcb-5dgkn"}--Details of a specific pod, such as the exact Docker image used -
kube_pod_created{pod="kafka-1"}--The timestamp when a specific pod was created
Some of these metrics are used in the dashboards provisioned by Grafana.
Blackbox exporter
Prometheus uses the blackbox exporter pod to run HTTP probes identified by the annotation prometheus.io/probe=true on any deployed service.
annotations:
  prometheus.io/probe: "true"
  prometheus.io/path: "/unblu/rest/product"
  prometheus.io/probename: "Unblu"
By default, a probe named "Unblu" is configured on the NGINX service. It triggers a request through all caching and load-balancing layers in the cluster.
The results of this probe are exposed as Prometheus metrics.
probe_success{kubernetes_service="nginx",probe_name="Unblu",probe_path="/unblu/rest/product"} 1
probe_http_status_code{kubernetes_service="nginx",probe_name="Unblu",probe_path="/unblu/rest/product"} 200
probe_duration_seconds{kubernetes_service="nginx",probe_name="Unblu",probe_path="/unblu/rest/product"}	0.014600436
probe_http_content_length{kubernetes_service="nginx",probe_name="Unblu",probe_path="/unblu/rest/product"}	395
Integration
Federate Prometheus metrics
The Prometheus server embedded in the Unblu cluster deployment is preconfigured to scrape from all Unblu components.
You can use Prometheus federation to scrape all Unblu-specific metrics from the Unblu Prometheus pod and copy them into a company-managed Prometheus instance.
scrape_configs:
- job_name: 'federate-unblu-prometheus'
  scrape_interval: 10s (1)
  honor_labels: true
  metrics_path: '/federate'
  params:
    'match[]':
      - '{kubernetes_namespace="unblu"}' (2)
  static_configs:
    - targets:
- 'prometheus.unblu.svc.cluster.local:80' (2)| 1 | The scrape interval has to be 10 seconds or less. Internally, Unblu collects metrics every 10 seconds. |
| 2 | Replace unblu with the actual namespace. |
Alternatively, you can duplicate this configuration (see config/prometheus.yml) into a company-managed shared Prometheus server. If you take this approach, you should check the Unblu Prometheus configuration for any changes when you update your installation. You should then update your Prometheus configuration to mirror those changes.
Storing metrics permanently
Prometheus isn’t designed to be used as a long-term storage location for data.
To permanently store metrics, you can combine federation with remote write.
remote_write:
- url: "https://influxdb.example.com/api/v1/prom/write?u=prometheus&p=password&db=prometheus"| Remote write can be used without federation. |