Adding data analytics for an Unblu Spark cluster
You can deploy data analytics tools to give your Unblu admins a better view of the data and events within your Unblu Spark installation. This involves deploying an OpenSearch cluster and Grafana as well as configuring Unblu Spark.
The Collaboration Server serves as an auth proxy. Neither Grafana nor the OpenSearch cluster need to be exposed to the internet.
Data analytics is accessible to Unblu users with the ADMIN role. Users with the SUPERVISOR role can also access data analytics if they’re supervisors of the default team.
This user is allowed only to view the data. Neither data source nor dashboard updates are possible. All dashboards are predefined in Unblu Spark and synchronized when an admin logs into Data analytics. The dashboards can’t be changed. If you need additional dashboards, contact the Unblu support team.
Data analytics is primarily intended for use with the Unblu Cloud. If you want to use it with an on-premises installation of Unblu Spark, contact the Unblu support team.
OpenSearch cluster deployment and configuration
The easiest way to deploy an OpenSearch cluster is to use either a Helm chart or an operator.
When your cluster is up and running, create a new user for it with permission to create, read, and update indices.
Grafana deployment
We recommend that you use a separate Grafana deployment. You can configure it by providing a grafana.ini file on startup. For more information, refer to the Grafana documentation.
The Grafana deployment must be configured to use auth proxy as an authentication method. The table below describes the other required settings:
| Name | Description |
|---|---|
[auth.proxy] section |
|
|
Enables auth proxy authentication |
|
Header used for authentication. Must be set to |
|
Defines which of user’s properties is passed int |
|
Defines if Grafana creates new user if one provided in the auth header doesn’t exist. Set to |
|
Encoding for non-ASCII characters in the auth header. Set to |
|
Set to |
|
Defines which information Grafana can find in auth headers. Must be set to |
[users] section |
|
|
Allows users to sign up manually. Set to |
|
When set to |
|
Sets the default role for new users. Set to |
[server] section |
|
|
Set to the root URL of the Collaboration Server including the protocol but without a trailing slash |
|
Set to the root URL of the Collaboration Server including the protocol, followed by the Grafana auth proxy path with a trailing slash |
[live] section |
|
|
Set to |
Your grafana.ini file should end up looking similar to the example below:
grafana.ini config file
[snapshots]
external_snapshot_url = https://my-unblu-deployment-domain.com/app/grafana (1)
external_snapshot_name = Send to Unblu
[auth.proxy]
enabled: true
header_name: X-WEBAUTH-USER
header_property: username
auto_sign_up: false
enable_login_token: false
headers: "Name:X-WEBAUTH-NAME Email:X-WEBAUTH-EMAIL Role:X-WEBAUTH-ROLE"
[users]
allow_sign_up: false
auto_assign_org: true
auto_assign_org_role: Viewer
[server]
domain: https://my-unblu-deployment-domain.com (2)
root_url: https://my-unblu-deployment-domain.com/app/grafana/ (3)
[live]
max_connections: 0| 1 | Only required if you use Grafana’s snapshot feature. Replace the URL with the appropriate value for your deployment. |
| 2 | Replace with the appropriate URL for your Grafana installation. |
| 3 | Replace with the domain of your Unblu deployment. |
Collaboration Server configuration
To enable External Analytics in the Collaboration Server, a bunch of additional properties must be set.
| Property name | Description |
|---|---|
com.unblu.analytics.enabled |
Enables OpenSearch cluster configuration. |
com.unblu.search.engine.es.host |
URL of the OpenSearch cluster with port, for example https://opensearch:9200. Defined during cluster deployment. |
com.unblu.search.engine.es.username |
The username of the user created in the OpenSearch cluster. Must have index create and update permissions. |
com.unblu.search.engine.es.password |
The password of the user created in the OpenSearch cluster. |
Enables Grafana configuration. |
|
com.unblu.analytics.grafana.grafanaRootUrl |
The host of the Grafana deployment, for example |
com.unblu.analytics.grafana.grafanaAdminUser |
Username of the Grafana user. Used to manage users and organizations. Must have admin permissions. |
com.unblu.analytics.grafana.grafanaAdminPassword |
Password of the Grafana user. |
com.unblu.analytics.grafana.grafanaDataSourceName |
Name of the datasource created in Grafana for each user, for example |
com.unblu.analytics.grafana.grafanaDataSourceUrl |
URL of the OpenSearch cluster, for example |
com.unblu.analytics.grafana.grafanaDataSourceUsername |
Username of the OpenSearch user that Grafana accesses OpenSearch with. Must have index read permissions. |
com.unblu.analytics.grafana.grafanaDataSourcePassword |
Password of the OpenSearch user that Grafana accesses OpenSearch with. |
Enables access to External Analytics from Unblu admin panel. Set to |
|
com.unblu.ui.usermenu.itemExternalAccountAnalytics |
The label of the menu item to access External Analytics. The default value is |
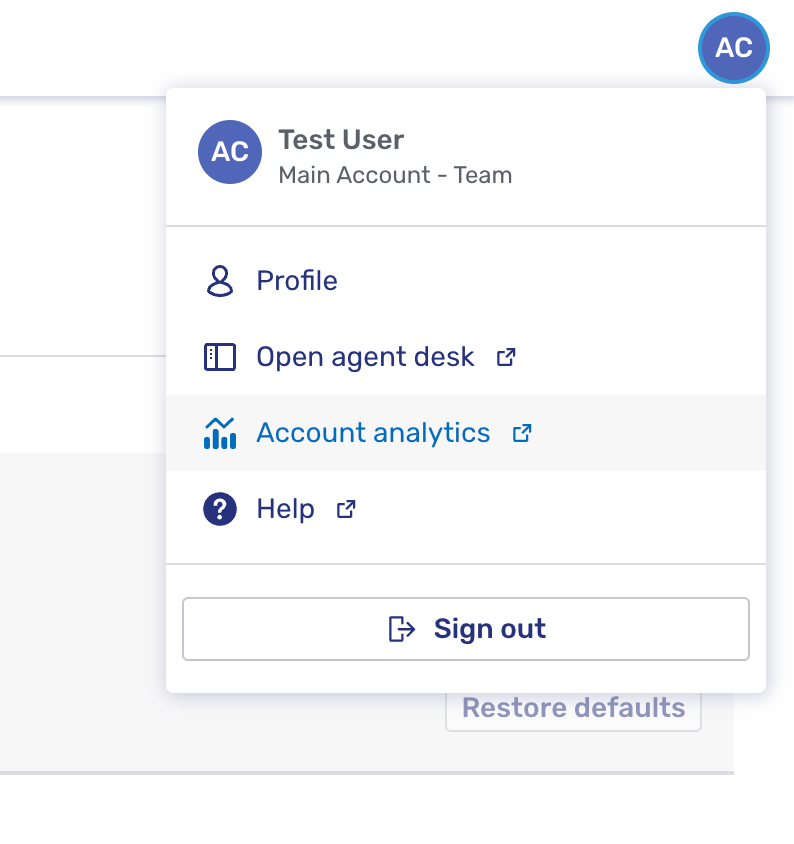
Accessing external account analytics
To access the analytics, open the Account Configuration interface and click your avatar in the upper right-hand corner to open the user menu. In the menu, click Account analytics to open Grafana.
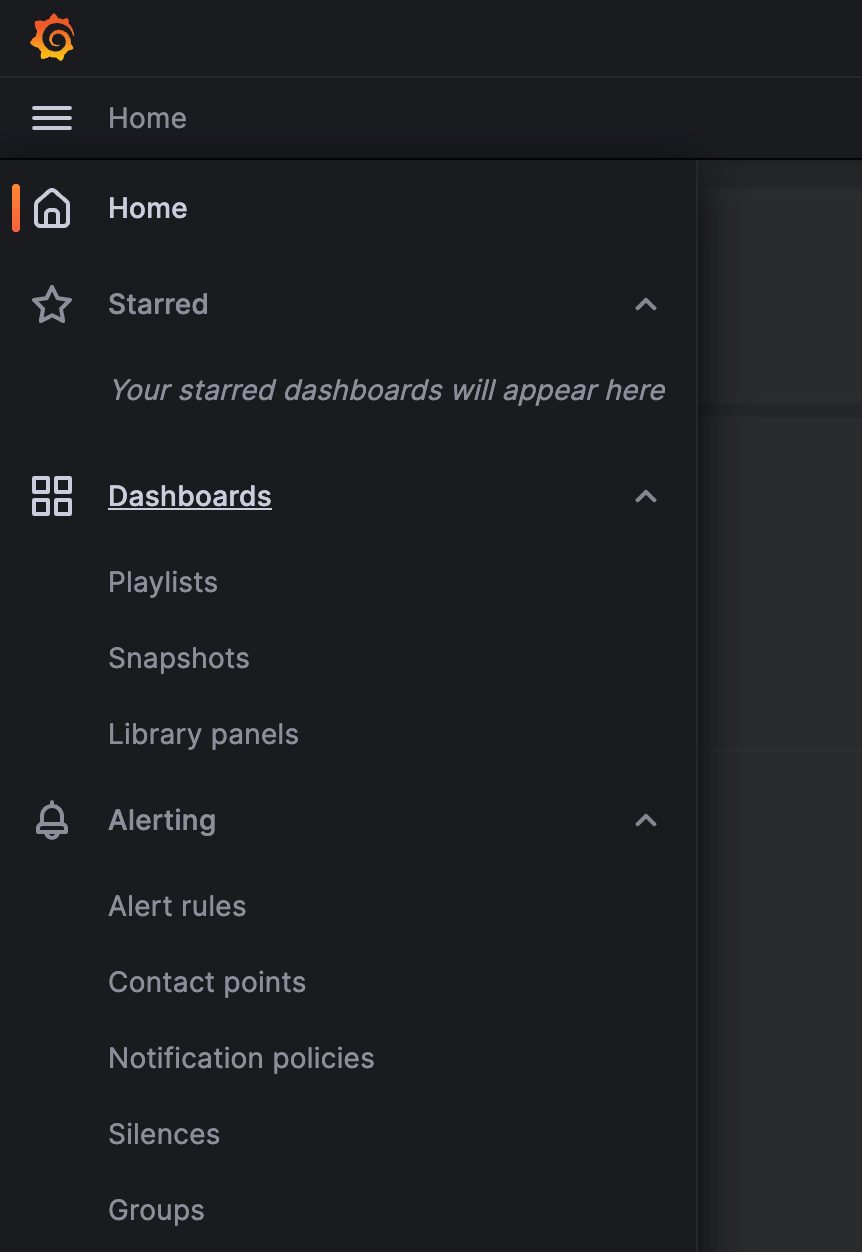
This opens Grafana. You can now access the dashboards through the burger menu ![]() in the top-left corner:
in the top-left corner:
See also
-
For more information on OpenSearch and Grafana, refer to the respective documentation (OpenSearch, Grafana).